

AI observability tools monitor, trace, and analyze AI systems in production to improve visibility into reliability, performance, and accountability. These tools collect model‑specific telemetry such as latency, token usage, throughput, drift, and anomalies across AI pipelines. Unlike traditional monitoring, AI observability focuses on model outputs, inputs, and decision paths. This level of observability, paired with structured evaluation, testing, and governance practices ensure models remain accurate, safe, and aligned at scale.
AI is woven into everything we build today, from customer support bots to automated knowledge systems and even mission-critical workflows.
But here’s the catch. Unlike traditional software, AI can behave unpredictably once it hits production, leaving teams guessing what went wrong and why.
When an AI model drifts, hallucinates, or suddenly spikes your cloud spend, you need more than intuition. You need visibility into what is happening inside your models and pipelines.
That’s where AI observability tools step in. Instead of watching only response times, these tools give you the context you need to understand model behavior, catch drift or hallucinations early, and trace issues back to their root cause in minutes.
In this guide, we’ll cover the top AI observability tools in 2026 and how to pick the right one to fit your stack and goals.
What are AI observability tools?
AI observability tools help teams monitor, trace, debug, and optimize AI systems, especially those powered by LLMs. Unlike traditional monitoring tools that track infrastructure health or service availability, AI observability solutions are designed to make sense of high-dimensional data: token usage, prompt-response patterns, model drift, hallucinations, and more.
The goal of these platforms is to create a clear line of sight from user inputs to model behavior, making it easier to troubleshoot issues, optimize performance, and ensure reliable, safe deployment.
AI observability vs AI governance: What is the difference?
While AI observability and AI governance are often mentioned together, they serve distinct yet complementary functions in managing machine learning systems.
AI observability focuses on real-time visibility into model performance, tracing outputs, identifying anomalies, and debugging production behavior. It helps teams monitor what’s happening inside AI systems, tracking metrics like latency, drift, and failure modes.
AI governance, on the other hand, ensures responsible and compliant AI usage. It includes policies, access controls, model documentation, audit trails, and adherence to regulatory standards like GDPR or SOC 2.
|
Aspect |
AI Observability |
AI Governance |
|
Primary Goal |
Monitor and understand AI system behavior in real time |
Ensure responsible, compliant, and ethical AI usage |
|
Focus Area |
Operational visibility into model performance, outputs, and system health |
Policy enforcement, risk management, accountability, and regulatory alignment |
|
Scope |
Logs, metrics, traces, inference analysis, debugging |
Model documentation, data lineage, access control, compliance frameworks |
|
Users |
ML engineers, MLOps, DevOps, QA teams |
Compliance officers, legal teams, data stewards, auditors |
|
Typical Questions Answered |
“Why did the model fail?” “What caused latency spikes?” “Where’s the drift?” |
“Who accessed this model?” “Is the AI output auditable and fair?” |
|
Outputs |
Real-time dashboards, alerts, traces, metrics, root cause insights |
Audit logs, usage policies, model cards, and access reports |
|
Tool Examples |
Arize AI, Langsmith, Fiddler, Helicone, Langfuse |
OvalEdge, BigID, Collibra, IBM Data Governance |
|
Data Handling |
Collects live telemetry like embeddings, inputs/outputs, traces |
Defines how data is used, who can access it, and how it must be protected |
|
Compliance Role |
Helps surface issues that may violate standards or SLAs |
Ensures compliance with legal, privacy, and ethical standards (e.g., GDPR, SOC 2) |
|
Integration Focus |
Embedded in model serving, inference pipelines, and LLM orchestration layers |
Embedded in data management, metadata catalogs, and policy management systems |
|
Automation |
Triggers alerts, performance checks, and model evaluations |
Automates audits, role-based access, and policy enforcement |
|
Deployment Models |
Cloud, on-prem, hybrid; often tied to MLOps stack |
Cloud, VPC, or on-prem, depending on data sensitivity |
|
Feedback Loops |
Continuous debugging and optimization based on observability signals |
Continuous compliance monitoring and audit readiness |
Also read: Trusted AI: Why AI Governance is a Business-Critical Concern
Top AI observability tools for 2026
Choosing the right AI observability tool is critical for maintaining control over how models perform, evolve, and behave in production. In 2026, the ecosystem has matured with platforms specializing in everything from prompt-level tracing and token analytics to multi-agent workflow visibility.
This section breaks down the leading tools shaping AI observability, highlighting what each does well, where they fall short, and which use cases they serve best.
1. Arize AI
Arize AI is an AI observability platform designed to monitor machine learning and LLM systems in production. It focuses on understanding how models behave over time by analyzing inputs, outputs, embeddings, and performance signals after deployment.
Arize is often positioned as a bridge between data science experimentation and production reliability.
Key features
-
Performance tracing: Provides deep visibility into model behavior by showing how different prediction slices perform using heatmaps and filtering‑based breakdowns. This helps uncover specific failure modes and understand what parts of the model are underperforming.
-
Explainability: Delivers insights into why models make certain decisions by exposing feature importance and other interpretability metrics. This supports bias detection, optimization, and deeper understanding of outcomes.
-
Dashboards and monitors: Offers dynamic, automated monitoring dashboards that display real‑time model health, drift, and performance metrics. These dashboards serve as a central hub for root‑cause analysis workflows.
-
Model and feature drift detection: Tracks and compares model predictions and feature distributions across training, validation, and production environments to flag unexpected shifts before performance degrades.
-
Embedding and anomaly analysis with clustering tools: Supports advanced workflows like embedding monitoring and AI‑driven cluster search to identify emerging patterns, outliers, and problematic data cohorts for deeper investigation.
Pros
-
Strong depth in drift detection and root cause analysis
-
Works well for both traditional ML models and modern LLM pipelines
-
Embedding analysis provides visibility that basic monitoring tools lack
-
Open-source Phoenix project supports experimentation and adoption
Cons
-
Learning curve for teams without prior ML observability experience
-
Less lightweight than proxy-based tools for simple cost tracking
-
UI can feel dense for teams focused only on LLM prompts
Pricing
Arize AI pricing is structured by team size, deployment model, and feature depth. The Phoenix edition is free and open source, offering fully self-managed span tracing with no usage limits.
AX Free is a no-cost SaaS option for individuals and startups, supporting 25,000 spans and 1 GB of ingestion per month with 7-day retention, and includes access to Alyx and product observability features.
AX Pro costs $50 per month and doubles the span and ingestion limits while extending retention to 15 days, with added email support.
For larger teams, AX Enterprise offers custom pricing and deployment with configurable limits, SOC 2 and HIPAA compliance, uptime SLAs, training, and data residency options.
Best for
Mid to large teams running production ML or LLM systems who need long-term visibility into model behavior, drift, and quality trends.
Ratings
2. LangSmith
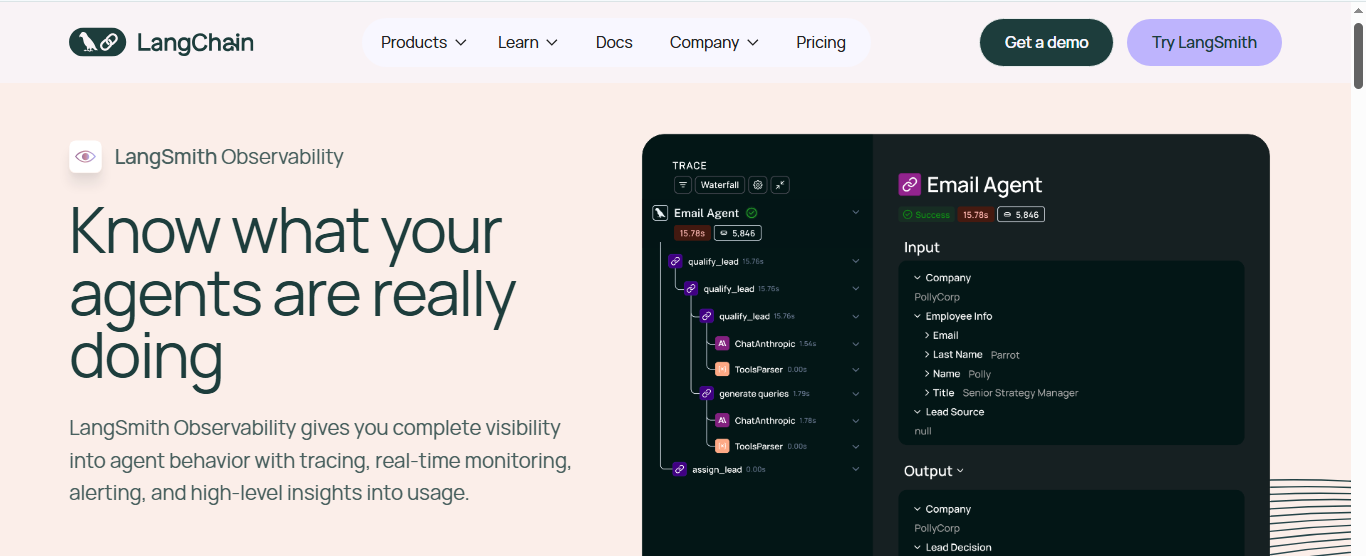
LangSmith is an AI observability and debugging tool built specifically for LLM workflows created with LangChain. It focuses on tracing prompt execution, agent reasoning steps, and chained calls to help teams understand how LLM-powered applications behave in real usage.
Key features
-
Trace capture and visualization: Records every step of an LLM application’s execution from input to output, including model calls, tool invocations, and intermediate operations, and lets teams explore these traces to debug or understand behavior.
-
Real‑time monitoring: Provides dashboards and live performance metrics for latency, usage patterns, error rates, and other operational signals that help teams detect issues and optimize production workflows.
-
Configurable alerting and automation: Allows users to set up alerts for performance regressions, failures, or anomalous behavior and configure rules, webhooks, or workflows to respond when predefined conditions are met.
-
Evaluation and feedback integration: Supports building evaluation workflows with datasets, offline and online evals, human annotation queues, and scoring, so teams can measure quality and improve output over time.
-
Framework‑agnostic observability: Works with LangChain, LangGraph, or custom LLM applications via SDK, enabling observability across different workflows without requiring major code rewrites.
Pros
-
Deep visibility into complex LLM chains and agents
-
Designed around real developer debugging workflows
-
Strong alignment with modern RAG and agent architectures
-
Low-friction setup for LangChain users
Cons
-
Limited value outside the LangChain ecosystem
-
Less emphasis on long-term model drift or fairness metrics
-
Not designed for traditional ML observability
Pricing
LangSmith pricing is based on usage and team size. The Developer plan is free for individual users and includes 5,000 traces per month, prompt debugging tools, evaluations, and up to 50 Agent Builder runs.
The Plus plan costs $39 per seat per month, adding 10,000 traces, unlimited agents, 500 Agent Builder runs, and support for team deployments with usage-based billing.
The Enterprise plan uses custom pricing and includes advanced hosting options, custom SSO, RBAC, SLAs, team training, and architectural support for large-scale or regulated deployments.
Best for
Teams building LLM agents, RAG pipelines, or complex prompt chains that need detailed execution visibility.
Ratings
3. Langfuse
LangSmith is an AI observability and debugging tool built specifically for LLM workflows created with LangChain. It focuses on tracing prompt execution, agent reasoning steps, and chained calls to help teams understand how LLM-powered applications behave in real usage.
Key features
-
Trace and session capture: Records end‑to‑end traces and sessions for LLM calls and related operations (generations, tool calls, RAG retrievals), enabling developers to explore the complete execution path of user interactions.
-
Hierarchical observations: Supports rich observation types such as spans, generations, agents, tool calls, retrievers, and embeddings to provide detailed context and filtering within traces.
-
Customizable metrics dashboards: Derives actionable insights from observability traces, including cost, latency, and quality metrics, with dashboards and an API for segmentation by tags, model, user, or version.
-
OpenTelemetry‑native integration: Built on OpenTelemetry, Langfuse can ingest spans from existing instrumentation frameworks and unify AI trace data with standard telemetry pipelines.
-
Attribute tagging & filtering: Lets users add tags and attributes to traces and observations for structured filtering, segmentation, and targeted analysis of performance or error patterns.
Pros
-
Transparent and extensible architecture
-
Strong developer adoption and community support
-
Works across multiple LLM providers
-
Avoids vendor lock-in concerns
Cons
-
Requires more setup and operational ownership
-
Fewer out-of-the-box governance features than an enterprise governance tool
-
Limited advanced drift and fairness analytics
Pricing
Langfuse pricing is based on scale, support, and deployment preferences.
The Hobby plan is free, includes 50,000 units per month, 30-day data access, and is best for personal projects or proofs of concept.
The Core plan costs $29 per month and adds 100,000 units, 90-day data access, unlimited users, and in-app support, with additional usage billed from $8 per 100k units.
The Pro plan, at $199 per month, includes unlimited data retention, higher throughput, SOC2 and ISO27001 reports, and support for HIPAA compliance.
The Enterprise plan is $2,499 per month and includes audit logs, SLAs, SCIM API, architecture reviews, and dedicated support.
Best for
Engineering teams that want flexible, open-source LLM observability without sacrificing core monitoring capabilities.
4. Helicone
Helicone is a lightweight AI observability tool that operates as a proxy for LLM API calls. Its primary focus is cost visibility, request logging, and basic performance monitoring for teams using providers like OpenAI.
Key features
-
Automatic request tracking: Logs every LLM request and response without extra instrumentation, capturing latency, token usage, costs, and model performance metrics by default.
-
Unified model observability: Provides a consolidated dashboard that tracks performance, usage, and errors across all supported LLM providers through a single interface, simplifying monitoring for multi‑provider deployments.
-
Cost tracking and optimization: Analyzes per‑request costs and overall usage, helping teams monitor spending across models and users and optimize token efficiency.
-
Session and user analytics: Tracks sessions and user behavior patterns, enabling teams to analyze engagement, usage trends, and feature adoption.
-
Custom logs and metadata: Allows logging of custom operations and attaching structured metadata to requests, enabling flexible segmentation and deeper analysis of performance or error patterns.
Pros
-
Extremely fast to deploy
-
Clear visibility into LLM spend drivers
-
Useful for early-stage products and prototypes
-
Low operational overhead
Cons
-
Limited support for complex workflows and agents
-
No advanced drift or quality evaluation
-
Less suitable for large-scale observability needs
Pricing
Helicone pricing is designed to scale with usage and team needs. The Hobby plan is free and includes 10,000 monthly requests, 1 GB of storage, and access for one user and organization.
The Pro plan costs $79 per month and adds unlimited seats, custom alerts, reports, and Helicone Query Language (HQL), with usage-based pricing beyond the free limits.
The Team plan is $799 per month and includes five organizations, SOC 2 and HIPAA compliance, and a dedicated Slack channel.
The Enterprise plan offers custom pricing and adds SAML SSO, on-prem deployment, custom MSAs, and bulk discounts.
Best for
Startups and small teams that want immediate insight into LLM usage, cost, and reliability.
Ratings
5. Maxim AI
Maxim AI focuses on observability for AI agents and autonomous systems. Rather than treating LLM calls in isolation, it tracks how agents reason, make decisions, and progress toward goals across multi-step workflows.
Key features
-
Distributed tracing architecture: Tracks the complete lifecycle of AI agent requests, capturing sessions, spans, LLM calls, tool calls, and context retrieval steps to provide granular end‑to‑end visibility.
-
Real‑time monitoring and alerting: Monitors live production metrics such as latency, token usage, cost per trace, and quality scores, and sends alerts via integrations like Slack or PagerDuty when thresholds are exceeded.
-
OpenTelemetry‑compatible observability: Supports forwarding logs and traces to other monitoring systems (e.g., New Relic, Snowflake) via OpenTelemetry, enabling integration with existing observability stacks.
-
Human-in-the-loop annotations: Enable teams to queue agent outputs for human review, allowing subject-matter experts to assess responses for accuracy, bias, and domain relevance. Annotations are integrated with automated evaluation workflows to enhance overall assessment quality and fine-tune model behavior.
-
Custom evaluation integration: Attaches evaluators like task success and trajectory quality to traces and sessions to measure real‑world performance trends and detect regressions in agent behavior over time.
Pros
-
Purpose-built for agent-based architectures
-
Clear view of decision paths and failures
-
Supports emerging AI-native application patterns
-
Helps debug non-deterministic agent behavior
Cons
-
Less suitable for simple prompt-based applications
-
Smaller ecosystem compared to older platforms
-
Still evolving feature maturity
Pricing
Maxim AI pricing is tiered by team size, observability scale, and security requirements. The Developer plan is free forever and supports up to three seats, one workspace, 10,000 logs per month, and 3‑day data retention.
The Professional plan costs $29 per seat per month and expands capacity to 100,000 logs, three workspaces, and 7‑day retention.
The Business plan is priced at $49 per seat per month and introduces unlimited workspaces, 500,000 logs, and 30‑day retention.
The Enterprise plan uses custom pricing and adds advanced security and compliance features, with dedicated customer support for large‑scale deployments.
Best for
Teams building autonomous agents, copilots, or complex AI workflows that require decision-level observability.
Ratings
6. Fiddler AI
Fiddler AI is an enterprise-grade AI observability platform with a strong focus on explainability, fairness, and compliance. Originally built for traditional ML models, it has expanded to support LLM monitoring within regulated environments.
Key features
-
Unified visibility and context: Provides a centralized view of performance and behavior for ML models, LLMs, and AI agents throughout their lifecycle, enabling teams to monitor outputs, errors, and decision lineage in real time.
-
Real‑time monitoring and alerts: Continuously tracks model performance, drift, prediction accuracy, safety metrics, and other signals, and sends alerts for anomalies or threshold breaches to help teams respond quickly.
-
Explainability and root cause analysis: Offers explainable AI methods and diagnostics that help teams understand why models behave a certain way, supporting transparency, bias detection, and issue investigation.
-
Integrated guardrails and security: Includes real‑time guardrails and trust models to enforce policy, detect harmful outputs like hallucinations or toxic responses, and protect AI systems from safety and compliance risks.
-
Custom dashboards and governance tools: Enables creation of tailored visual dashboards, tracking of enterprise‑grade metrics, and governance capabilities that unify observability with reporting and compliance across large AI deployments.
Pros
- Strong compliance and governance features
- Suitable for regulated industries
- Deep explainability for model decisions
- Centralized observability across model types
Cons
-
Heavier platform footprint
-
Less developer-centric for prompt debugging
-
Slower iteration for experimental LLM workflows
Pricing
Fiddler AI pricing scales with observability needs and deployment complexity. The Free plan offers real-time AI guardrails with latency under 100ms to detect hallucinations, toxicity, PII/PHI, prompt injection, and jailbreak attempts.
The Developer plan is pay-as-you-go at $0.002 per trace and includes unified AI observability for both predictive and agentic systems, custom evaluators, visual insights, role-based access control, SSO, and SaaS deployment.
The Enterprise plan offers custom pricing and adds enterprise-grade guardrails, infrastructure scalability, deployment flexibility (SaaS, VPC, or on-premise), and white-glove support.
Best for
Large organizations in finance, healthcare, and regulated sectors that require explainability and auditability.
Ratings
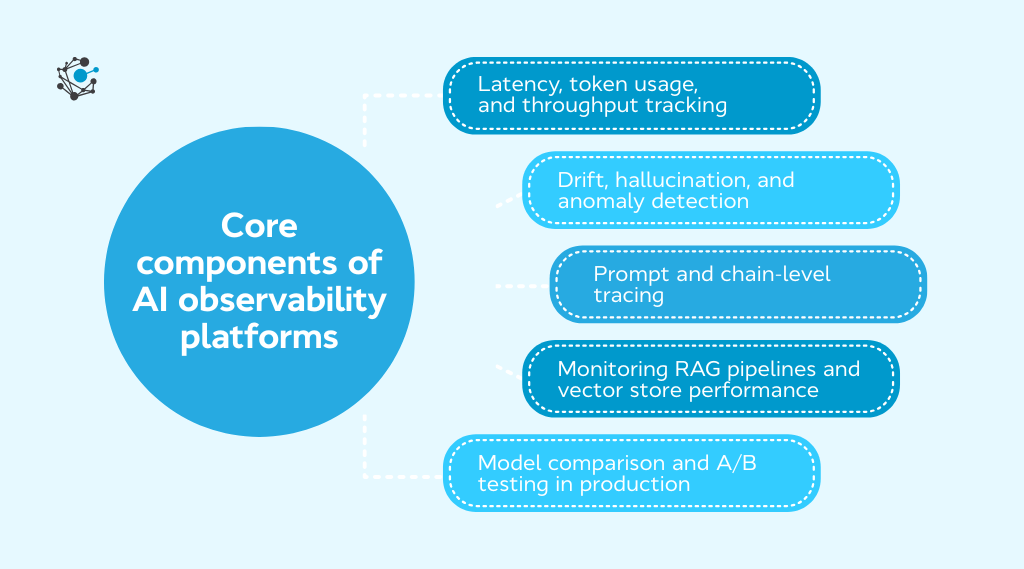
Core components of AI observability platforms
AI observability platforms are built around a core set of components that capture system-level and model-specific signals such as latency, token usage, throughput, drift, hallucinations, anomalies, and execution traces. Together, they provide the telemetry needed to ensure reliability, performance, and accountability across LLM pipelines.
Latency, token usage, and throughput tracking
Tracking latency, token usage, and throughput are metrics that serve as early indicators of system inefficiencies, degraded user experience, and runaway API costs.
Latency tracking in AI observability tools involves capturing detailed timing metrics at each stage of an LLM pipeline, starting from the moment a request is initiated to when the final response is delivered.
AI observability tools break down latency at the span level, showing how long each agent or prompt step takes. This allows teams to pinpoint exactly which part of the chain introduces delay, whether it’s an embedding search or a slow LLM API response.
Token usage tracking is a core capability of AI observability tools. AI observability platforms track token usage at multiple levels of granularity.
At the request level, they record how many tokens are consumed by the prompt, system instructions, retrieved context, and the generated response.
At a higher level, they aggregate token usage by user, feature, endpoint, or model version, making it easier to understand where consumption is concentrated across the application.
Token usage tracking is also critical for governance and optimization. By establishing baselines and monitoring deviations, teams can detect unexpected spikes caused by prompt changes, looping agents, or malformed inputs. This enables proactive controls such as usage caps, alerting, or prompt refactoring before costs escalate.
Throughput tracking measures how many inference requests or completions a system handles over a given time frame. It's a core metric because it directly reflects system capacity, performance bottlenecks, and user demand patterns.
AI Observability tools track throughput by logging metrics like total requests processed per time unit, concurrent requests handled without degradation, success and failure rates at varying times, and traffic pattern trends.
Ultimately, throughput tracking ensures teams aren't just measuring performance in isolation but are continuously testing whether the system can sustain its intended scale under real conditions.
Drift, hallucination, and anomaly detection
Drift, hallucination, and anomaly detection are core to ensuring model reliability and alignment in production environments.
Drift detection in AI observability refers to identifying shifts in how models behave over time, particularly in response to changes in input data or use-case context. Unlike traditional ML drift, LLM drift is typically semantic and harder to catch without embedding-based analysis.
AI observability tools address this using embedding distance metrics to track shifts in inputs and outputs, continuously comparing new data to historical baselines, and flagging when inputs no longer resemble the distributions the model was optimized for.
This allows teams to spot early signs of degradation and retrain or fine-tune before the impact spreads across production workflows.
Hallucinations occur when LLMs generate outputs that are syntactically fluent but factually incorrect or misleading. Unlike simple grammar or formatting issues, hallucinations often require deep semantic understanding or cross-referencing external facts to detect.
AI observability platforms monitor hallucination risks by a combination of techniques that include measuring output entropy to detect overconfident responses, comparing model completions against known references, and leveraging human-in-the-loop workflows to annotate outputs manually.
In production, hallucination monitoring also supports real-time intervention. Over time, this forms the basis of a feedback loop where model behavior is not just monitored but actively improved based on observed failure patterns.
Anomaly detection focuses on identifying unexpected behaviors in LLM performance, system metrics, or user interaction patterns. These anomalies can be subtle, such as a spike in latency during a specific prompt or a sudden surge in failure rates across multiple endpoints.
Unlike static threshold-based monitoring, observability tools use statistical methods and time-series analytics to detect anomalies dynamically. When combined with logs, traces, and structured metadata, anomalies can reveal root causes behind reliability issues, be it a new deployment, a change in upstream data, or a poorly structured prompt.
By enabling earlier detection and faster mitigation, anomaly tracking ensures that AI systems remain reliable under varying operational conditions and user behaviors.
Prompt and chain-level tracing
Prompt-level tracing focuses on the granularity of how a single prompt behaves, capturing the exact input, model response, any function calls or tool usage, and associated metadata like latency or token usage. While tracing is essential for understanding execution paths and debugging, it should be paired with evaluation and testing workflows to ensure output quality and reliability.
According to a 2025 McKinsey Global AI survey, 51 % of organizations using AI experienced at least one negative consequence from AI inaccuracy, highlighting the need for granular tracing to catch output issues.
Chain-level tracing supports reproducibility by capturing full execution logs, allowing teams to replay faulty sessions in observability dashboards or evaluation playgrounds, evaluate where agent decisions break down, and understand interdependencies across components like retrievers or memory buffers.
In production systems with thousands of daily interactions, tracing helps teams move beyond one-off prompt design into maintainable, scalable LLM infrastructure.
Monitoring RAG pipelines and vector store performance
Retrieval-Augmented Generation (RAG) systems blend language models with external knowledge sources, but their performance hinges on retrieval quality as much as model output.
AI observability tools now track RAG pipelines end-to-end: monitoring query latency, retrieval precision, and vector store behavior in real time.
Misconfigured similarity thresholds or slow queries can inject irrelevant context or delay responses, causing hallucinations or poor user experience.
By linking retrieval metrics to model outcomes, observability platforms help identify bottlenecks and improve contextual relevance. But identifying performance issues through metrics or traces alone doesn’t guarantee quality. To ensure the retrieved context enhances rather than degrades model output, structured evaluation methods must be integrated.
Model comparison and A/B testing in production
Selecting or deploying the best model version is not a one-time decision. It’s an ongoing process of testing, benchmarking, and validating how different prompts, model weights, or configurations perform in live environments. AI observability tools are increasingly supporting native A/B testing and model comparison capabilities to make this easier and safer.
AI observability tools monitor the key metrics, such as user feedback scores or click-through rates (for user-facing model), response latency and success rates, cost per call or tokens consumed, and drift or failure rate under real workload conditions to select the best model version.
By embedding this level of experimentation into the observability layer, engineering teams reduce the time and risk associated with model updates, while improving traceability and user satisfaction.
What goes wrong without observability?
When AI systems lack observability, issues often remain hidden until they escalate, damaging user trust, inflating costs, or violating compliance.
Without visibility into model decisions, teams struggle to detect drift, debug hallucinations, or respond to performance degradation in real time. Silent failures in production, like retrieval mismatches or pipeline bottlenecks, can go unnoticed until it’s too late.
Here’s what typically breaks:
-
Undetected Model Drift: Shifts in data or input patterns reduce model accuracy, but without monitoring, there's no trigger for retraining or investigation.
-
Debugging Blind Spots: Teams lack traceability into how and why a model made a decision, leading to longer mean time to resolution (MTTR) when issues arise.
-
Compliance Risks: Absence of audit logs or data lineage impairs regulatory reporting, especially when handling sensitive or governed data.
Observability bridges these gaps by offering real-time telemetry, trace-level insights, and actionable feedback loops.
How to evaluate AI observability tools
Selecting the right AI observability tool requires more than a feature checklist. The value lies in how well a platform aligns with your tech stack, governance needs, and scaling requirements. Here are the key dimensions to evaluate:
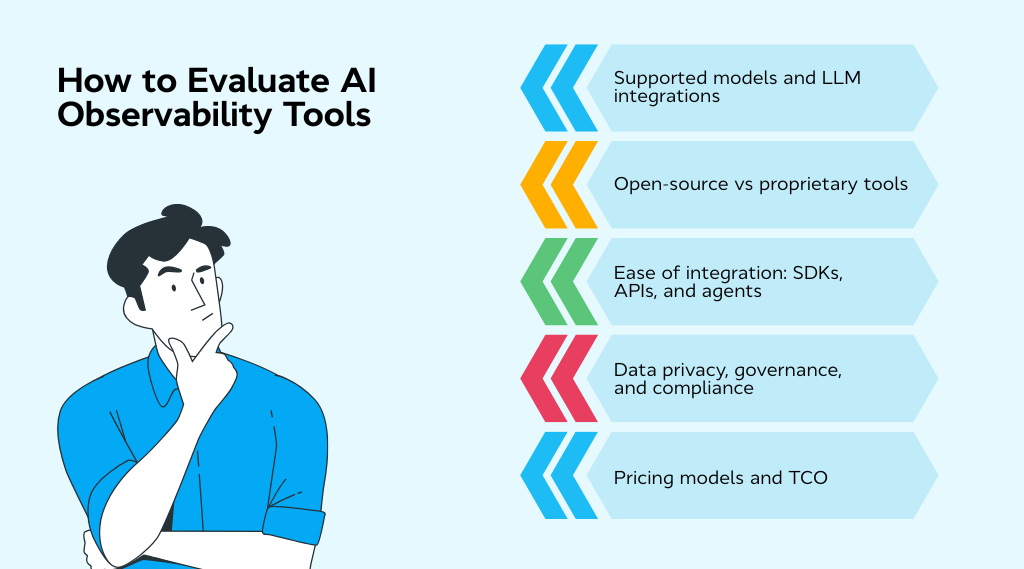
Supported models and LLM integrations
Ensuring compatibility with your current and future AI models is essential. The right observability tool should integrate smoothly with APIs from providers like OpenAI, Anthropic, Mistral, Cohere, or Hugging Face.
Things to do:
-
Audit your existing model stack and note key APIs used in production.
-
Check if the observability tool offers SDKs or native integrations for orchestration frameworks like LangChain or LlamaIndex.
-
Confirm whether the platform logs intermediate steps, prompts, and metadata for deeper visibility.
Open-source vs proprietary tools
Choosing between open-source and proprietary tools depends on your team’s needs for transparency, control, and support. Each has trade-offs in flexibility and time-to-value.
Things to do:
-
Evaluate internal engineering bandwidth for deploying and maintaining open-source tools like Langfuse.
-
Review enterprise features offered by proprietary tools such as Arize AI or Fiddler AI.
-
Assess long-term flexibility versus potential vendor lock-in for each option.
Ease of integration: SDKs, APIs, and Agents
Seamless integration into your model-serving infrastructure is key. Look for tools with robust SDKs, REST APIs, and proxy-based support to reduce disruption.
Things to do:
-
Verify support for programming languages and frameworks your team uses (e.g., Python, Node.js).
-
Look for passive logging options that won’t impact production traffic.
-
Prioritize tools with support for OpenTelemetry or structured logs to ease standardization.
Data privacy, governance, and compliance
Compliance is non-negotiable in AI observability. Look for tools that support SOC 2, ISO 27001, GDPR, and offer flexible deployment models for sensitive workflows.
Things to do:
-
Identify any regulatory requirements specific to your industry and geography.
-
Shortlist tools with data encryption, redaction, and audit logs.
-
Consider pairing observability tools with governance platforms like OvalEdge for full compliance coverage.
OvalEdge provides agentic data governance and privacy management, helping organizations classify sensitive data, enforce access policies, and maintain audit readiness.
Together, observability tools and governance platforms create an integrated compliance posture across data and AI pipelines.
Pricing Models and Total Cost of Ownership (TCO)
Beyond pricing tiers, consider the hidden costs, such as scaling, support, or missing features. Token-based models may spike costs under heavy workloads.
Things to do:
-
Estimate token usage or trace volume under typical production loads.
-
Calculate total cost, including integration and maintenance efforts.
-
Compare projected ROI with expected gains in uptime, accuracy, or debugging speed.
Human-in-the-Loop Workflows and Alerting
Proactive observability helps resolve issues faster. Look for tools that allow review workflows, annotations, and alert routing.
Things to do:
-
Enable alerts for key issues like model drift, latency, or hallucinations.
-
Check if the platform supports annotation interfaces or approval workflows.
-
Set up escalation paths to route flagged issues to the right teams.
Conclusion
AI and LLM models now sit at the core of how most companies build products, serve customers, and automate decisions. As these systems move deeper into production, AI observability tools have become essential for maintaining reliability, controlling costs, and preserving trust in model outputs.
Choosing the right observability platform matters because the wrong one can add complexity, slow teams down, or create hidden costs. The best tools align with your models, integrate cleanly into your stack, and provide clear signals on performance, drift, and failures without excessive overhead.
Start small by monitoring one production pipeline, validate the insights you gain, and expand coverage as your AI systems scale.
Want to make your AI outputs more trustworthy and production-ready?
Operational control through observability is essential. But it’s only half the picture. Policy control through data governance ensures your AI systems remain compliant, auditable, and aligned with business standards.
Before scaling your LLM applications, make sure your data pipelines are not just observable, but also governed and discoverable. OvalEdge empowers teams with both: enabling smarter data governance and laying the foundation for effective AI observability.
Book a demo with OvalEdge to see how it connects policy and operational layers, helping you deploy reliable, compliant, and scalable AI systems.
FAQs
1. What’s the difference between AI observability and traditional monitoring?
Traditional monitoring focuses on system health metrics like uptime, memory usage, or server latency. In contrast, AI observability tracks AI-specific signals such as model drift, hallucinations, prompt performance, and token-level latency. It enables root-cause analysis by tracing prompt chains, agent decisions, and model outputs at a granular level, which traditional tools aren’t equipped for.
2. How do AI observability tools help monitor AI pipelines in production?
AI observability tools capture detailed execution traces across complex pipelines, including prompt logs, retrieval quality in RAG systems, and agent decision paths. This allows teams to identify performance bottlenecks, debug failure points, and monitor throughput and token costs, all critical for operating AI at scale.
3. What metrics should be tracked for effective AI observability?
Core metrics include:
-
Latency (end-to-end, token-level, external API latency)
-
Token usage (input/output tokens, per feature or user)
-
Throughput (inference volume and concurrency)
-
Drift (semantic shifts in inputs/outputs over time)
-
Hallucinations (factually incorrect or misleading outputs)
-
Anomalies (unexpected errors or failure spikes)
4. Are there open-source AI observability tools available?
Yes, several open-source tools are available. For example, Langfuse offers prompt and chain-level tracing, token usage monitoring, and latency tracking with flexible cloud or self-hosted deployment. Arize AI also offers Phoenix, an open-source edition supporting model span tracing and drift detection.
5. What are examples of AI observability use cases?
Common use cases include:
-
Debugging hallucinations in chatbots
-
Monitoring agent workflows in autonomous systems
-
Detecting retrieval failures in RAG pipelines
-
Measuring token cost spikes from poorly designed prompts
-
A/B testing multiple LLMs or prompt versions in production
6. Why is observability important for AI systems?
AI systems can drift, hallucinate, or degrade silently after deployment. Observability provides visibility into these issues by detecting semantic drift, abnormal outputs, and performance regressions early. This helps teams maintain trust, control costs, and prevent unreliable or unsafe behavior in production AI applications.
Deep-dive whitepapers on modern data governance and agentic analytics
OvalEdge recognized as a leader in data governance solutions

.png?width=1081&height=173&name=Forrester%201%20(1).png)
“Reference customers have repeatedly mentioned the great customer service they receive along with the support for their custom requirements, facilitating time to value. OvalEdge fits well with organizations prioritizing business user empowerment within their data governance strategy.”
.png?width=1081&height=241&name=KC%20-%20Logo%201%20(1).png)
“Reference customers have repeatedly mentioned the great customer service they receive along with the support for their custom requirements, facilitating time to value. OvalEdge fits well with organizations prioritizing business user empowerment within their data governance strategy.”
Gartner, Magic Quadrant for Data and Analytics Governance Platforms, January 2025
Gartner does not endorse any vendor, product or service depicted in its research publications, and does not advise technology users to select only those vendors with the highest ratings or other designation. Gartner research publications consist of the opinions of Gartner’s research organization and should not be construed as statements of fact. Gartner disclaims all warranties, expressed or implied, with respect to this research, including any warranties of merchantability or fitness for a particular purpose.
GARTNER and MAGIC QUADRANT are registered trademarks of Gartner, Inc. and/or its affiliates in the U.S. and internationally and are used herein with permission. All rights reserved.